4 minute read · Free exercise
An Excel Budget Template That Shows What Changed
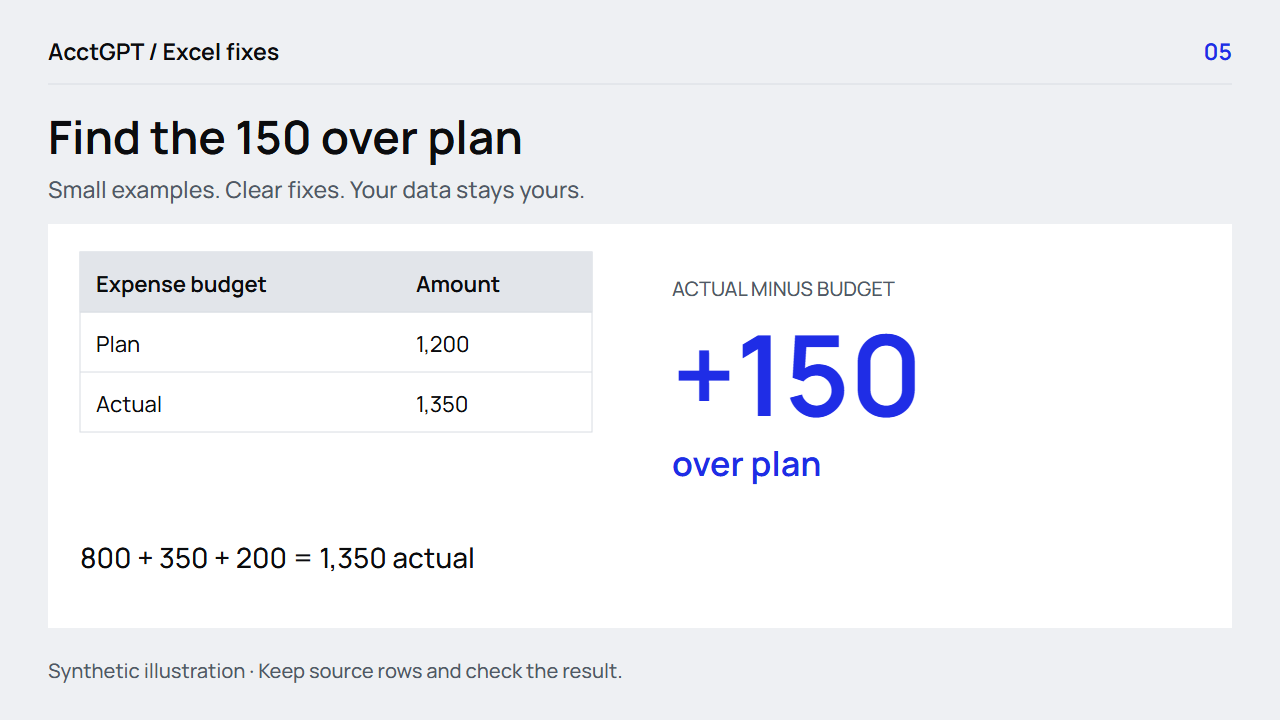
Your plan says 1,200. The expense log says 1,350. The useful number is 150 over plan, together with the transactions that explain it.
A workable Excel budget needs three parts: a transaction log, a plan and a summary that compares the two. Enter each transaction once, then let the summary do the adding.
For an expense budget: use SUMIFS to total the chosen category and month. Set variance to Actual-Budget. A positive result means over plan; in this example, 1,350 − 1,200 = +150.
1. Choose the month, currency and sign convention
Start with one currency. The practice example uses USD and November 2026. If your export contains several currencies, create separate totals or use an explicitly defined conversion process. Adding USD and MXN into one unlabeled number produces a misleading budget.
For the expense log, use positive amounts for spending. If a refund reduces spending, enter it as negative and keep its explanation. Treat transfers consistently so moving money between your own accounts does not accidentally become an expense twice.
Decide how to label the comparison:
| Measure | Calculation | Example |
|---|---|---|
| Actual expense | Sum of included transactions | 1,350 |
| Expense variance | Actual minus budget | +150 |
| Remaining budget | Budget minus actual | −150 |
The last two measures use opposite signs. Pick the one that serves your question and keep its label visible.
2. Keep transactions in one Table
The workbook's Transactions sheet contains three General expenses: 800, 350 and 200, each with a November date. The Table is named Transactions.
For your own version, useful columns are Date, Category, Description, Currency and Amount. Click inside the range, press Ctrl+T, confirm the headers and give the Table a meaningful name under Table Design.
Use real dates and numeric amounts. A date-shaped string can fail a date comparison. A text amount can be ignored by a sum. The formula checks show how to find that problem before it reaches a summary.
3. Pull the month with SUMIFS
Open Budget. A2 is the real date 1 November 2026, and B2 is the plan, 1,200. The actual total uses:
=SUMIFS(Transactions[Amount],
        Transactions[Category],"General",
        Transactions[Date],">="&A2,
        Transactions[Date],"<"&EDATE(A2,1))
This returns 1,350. The formula includes General expenses on or after the month start and before the next month start. It does not assume that every month has 30 days.
To summarize several categories, put their names down a column and use the category cell instead of the literal "General". For example, $A5 can hold Travel. Keep the month-start reference fixed when filling down so each category uses the same month.
Microsoft's SUMIFS reference explains how several criteria work together. For this task, every included row must satisfy all the conditions.
4. Show the variance plainly
In the example, C2 contains Actual and B2 contains Budget:
=C2-B2
The answer is 150. Label it Actual minus budget or Over/(under) plan, and explain that positive means over plan for this expense view.
You can add conditional formatting to draw attention to positive variances. Keep the number and label visible as well; color alone should not carry the meaning.
A useful summary lets you answer the next question. Which category changed? Was it an unexpected transaction, a timing difference, an uncategorized item or a plan that needs updating? The template organizes that review; it does not make the spending decision for you.
5. Check the month before copying the template
Before using the result, confirm:
- The source dates are real dates and the month start is correct.
- The three practice expenses total 1,350 independently.
- Uncategorized rows have not disappeared from the review.
- Refunds and transfers follow the stated convention.
- Currency totals remain separate.
Try adding a small December transaction to a working copy. November should remain unchanged. Then change the month start and confirm that the new transaction appears in the appropriate month.
Keep prior months rather than overwriting the only copy of their workings. When you want a category summary, continue with the PivotTable guide. For a small decision view with the same checks visible, use the dashboard guide.
The free workbook gives you the transaction and comparison structure. If the first obstacle is a pile of exports, combine the lists privately before bringing them into the budget.
Watch the check
Read the animation
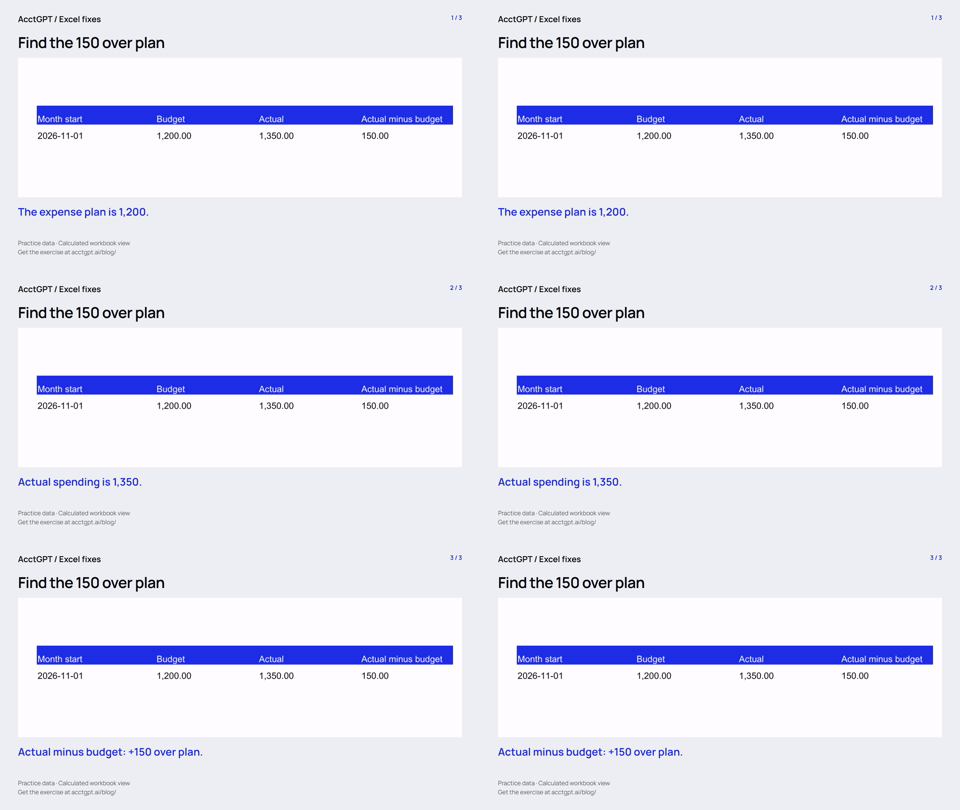
- The expense plan is 1,200.
- Actual spending is 1,350.
- Actual minus budget: +150 over plan.
Calculated practice values, shown as a short visual explanation. No narration or recording of Excel menu actions.

Try it on a small example
Use the synthetic exercise first, check its expected answers, then adapt a copy for your own work.
Free files, no signup. Separate from the invitation-only $5 reporting kit.
Compatibility and example checks
The core SUMIFS and EDATE example works in Excel 2016 and later. This is a spending organizer, not a tax calculator or financial recommendation.
The workbook’s formulas and source-edit/PivotTable refresh were checked with LibreOffice 26.8. Native Microsoft Excel editing, menu actions and Power Query execution are not yet verified for this release. The guide links to Microsoft’s instructions. The animations illustrate calculated examples rather than recording Excel actions.